At HENN Programming, my team and I were often asked to create new spaces for cutting-edge research. This inspired me to ask: how do different scientific fields tend to collaborate? Which types of research overlap with one another most often? Do different research topics tend to establish different types of communication networks?
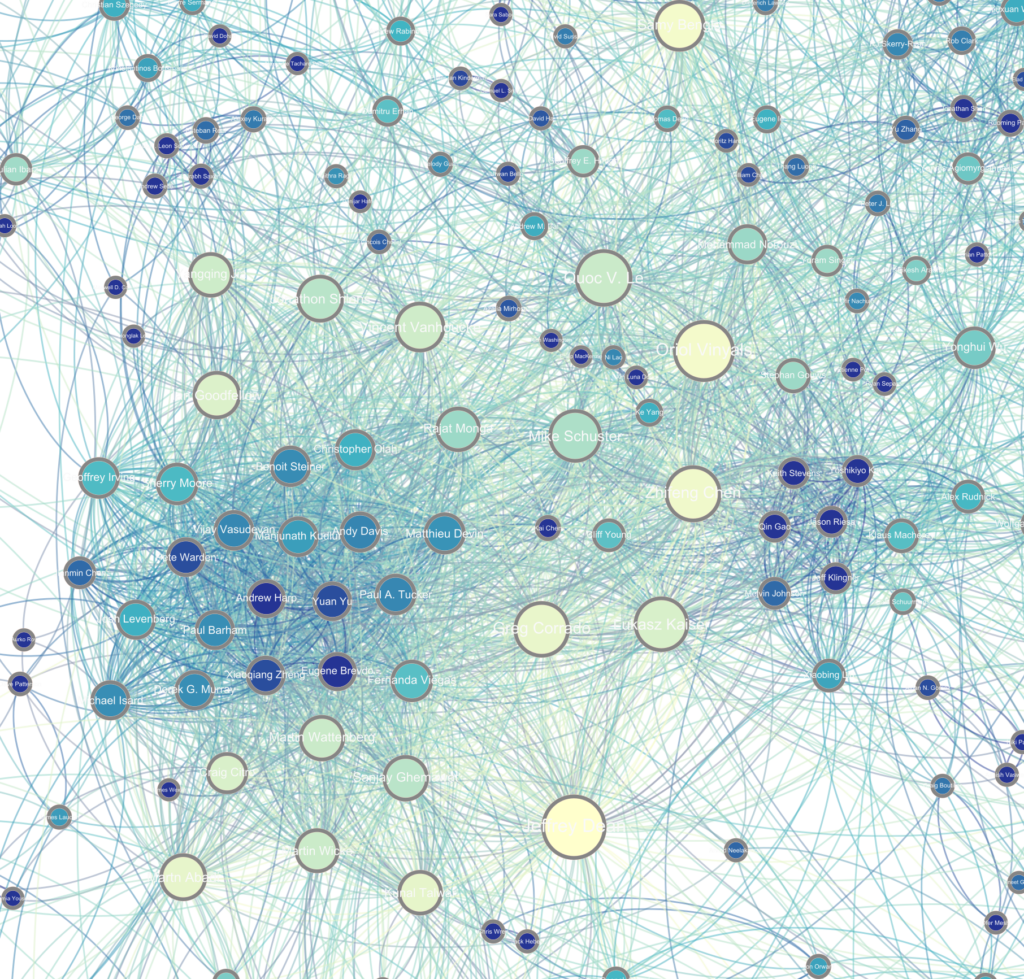
To look into this, I scraped a data set from Google’s research website including the roughly 1600 scientists working there at the time, the research groups they belonged to, and the other scientists with whom they had collaborated. Using Gephi, I was able to create a network graph of Google’s research network in which connections between scientists show their collaboration.
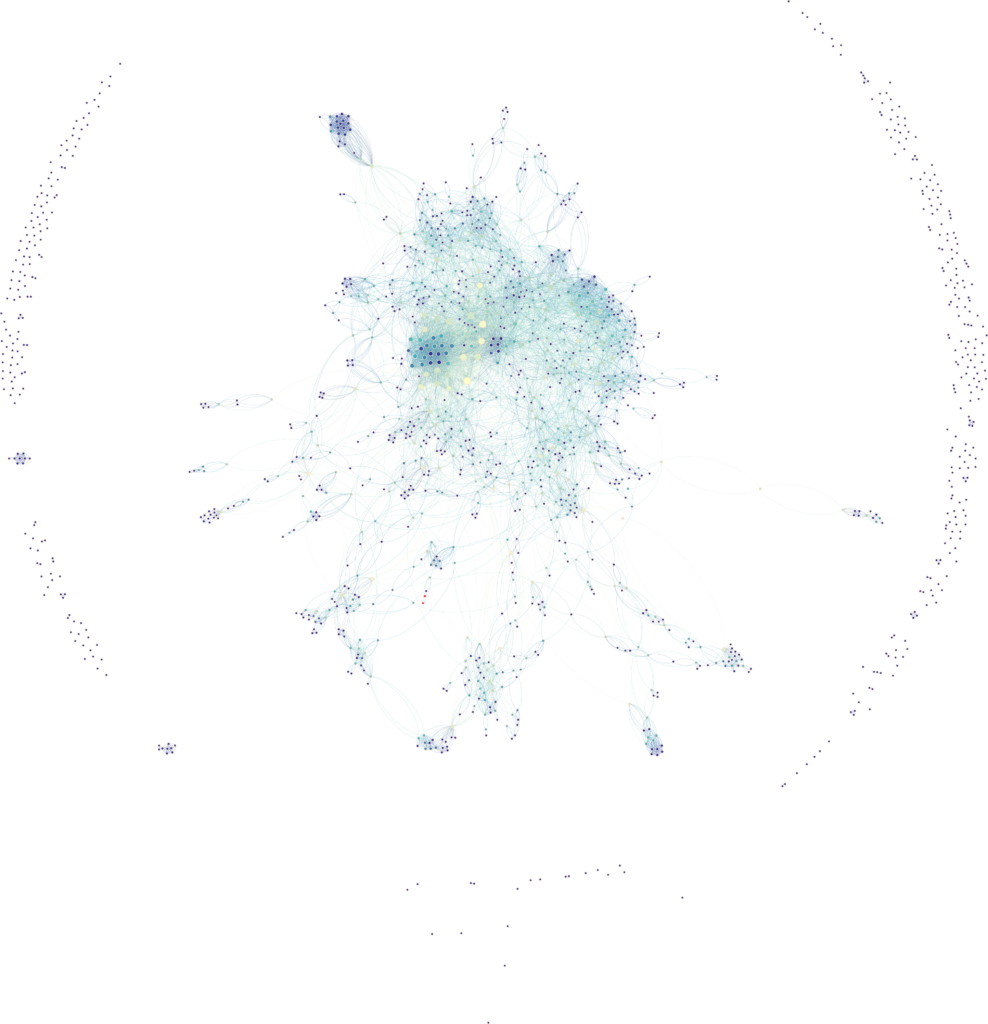
Looking at the overall shape of the graph, a dense center emerges with smaller sub-clusters connected to it, surrounded by a smaller ring of ‘isolated’ researchers and small groups.
Different research groups can be highlighted and viewed in context:
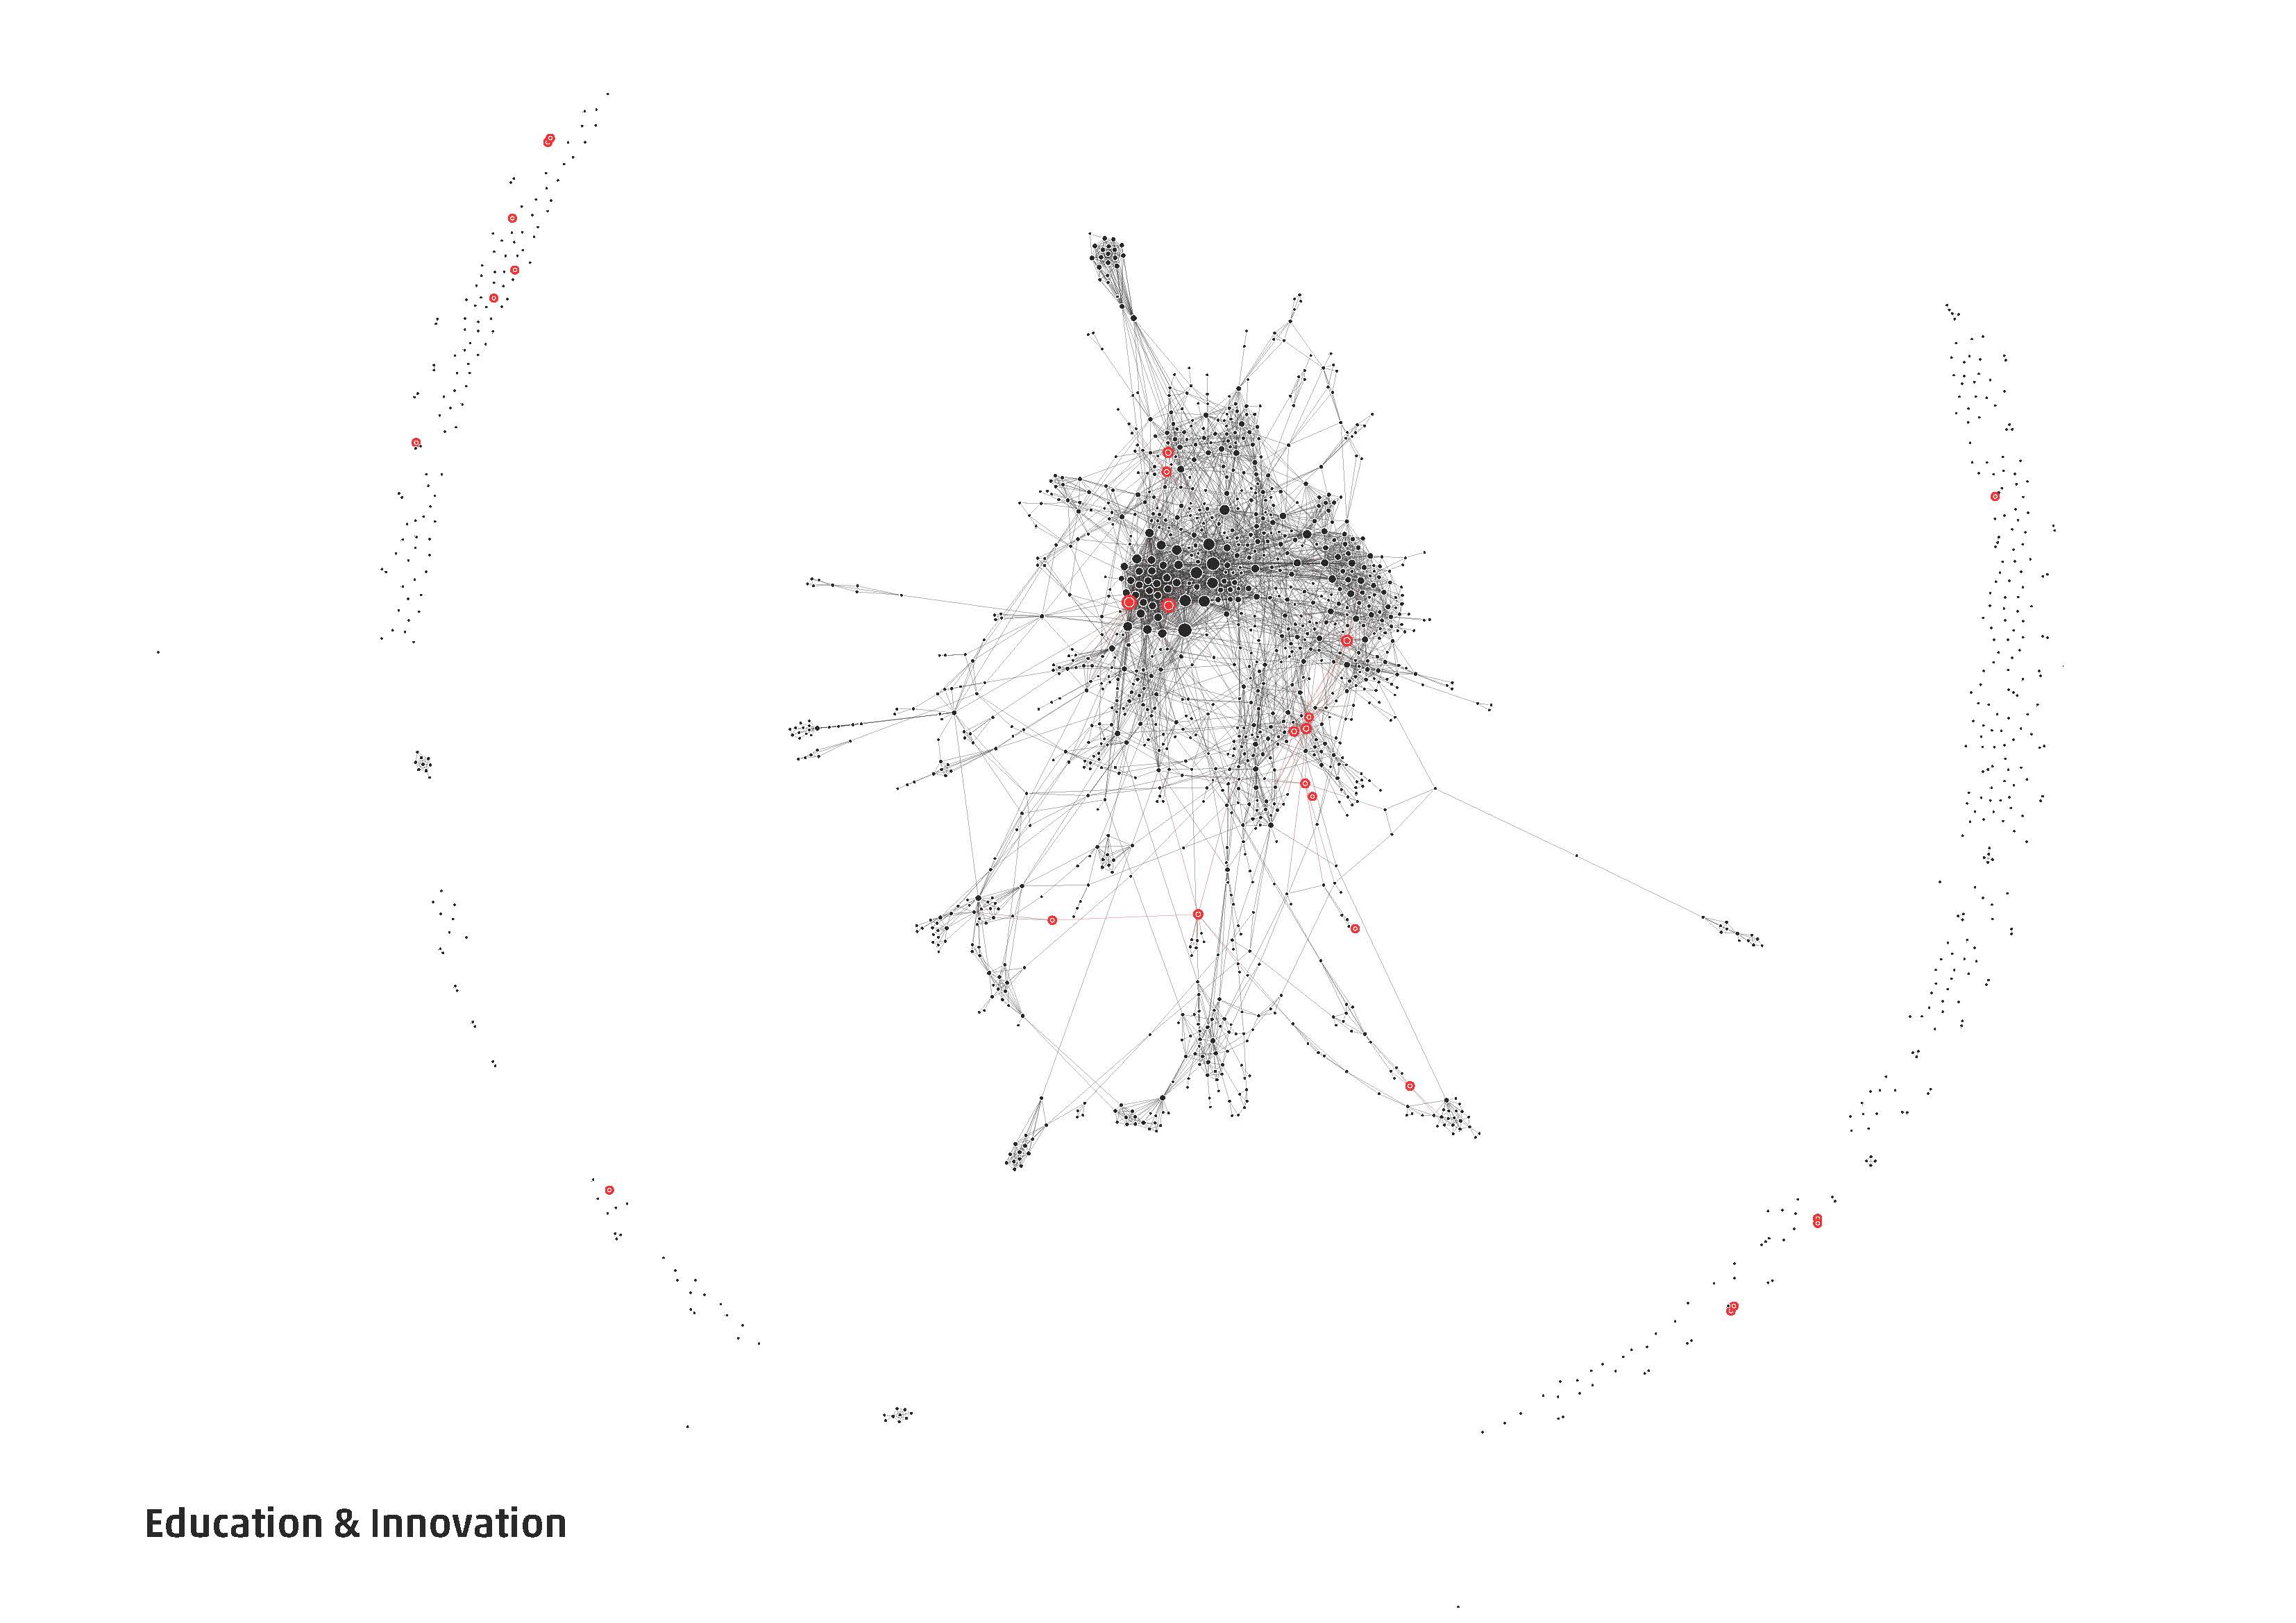
Small and distributed
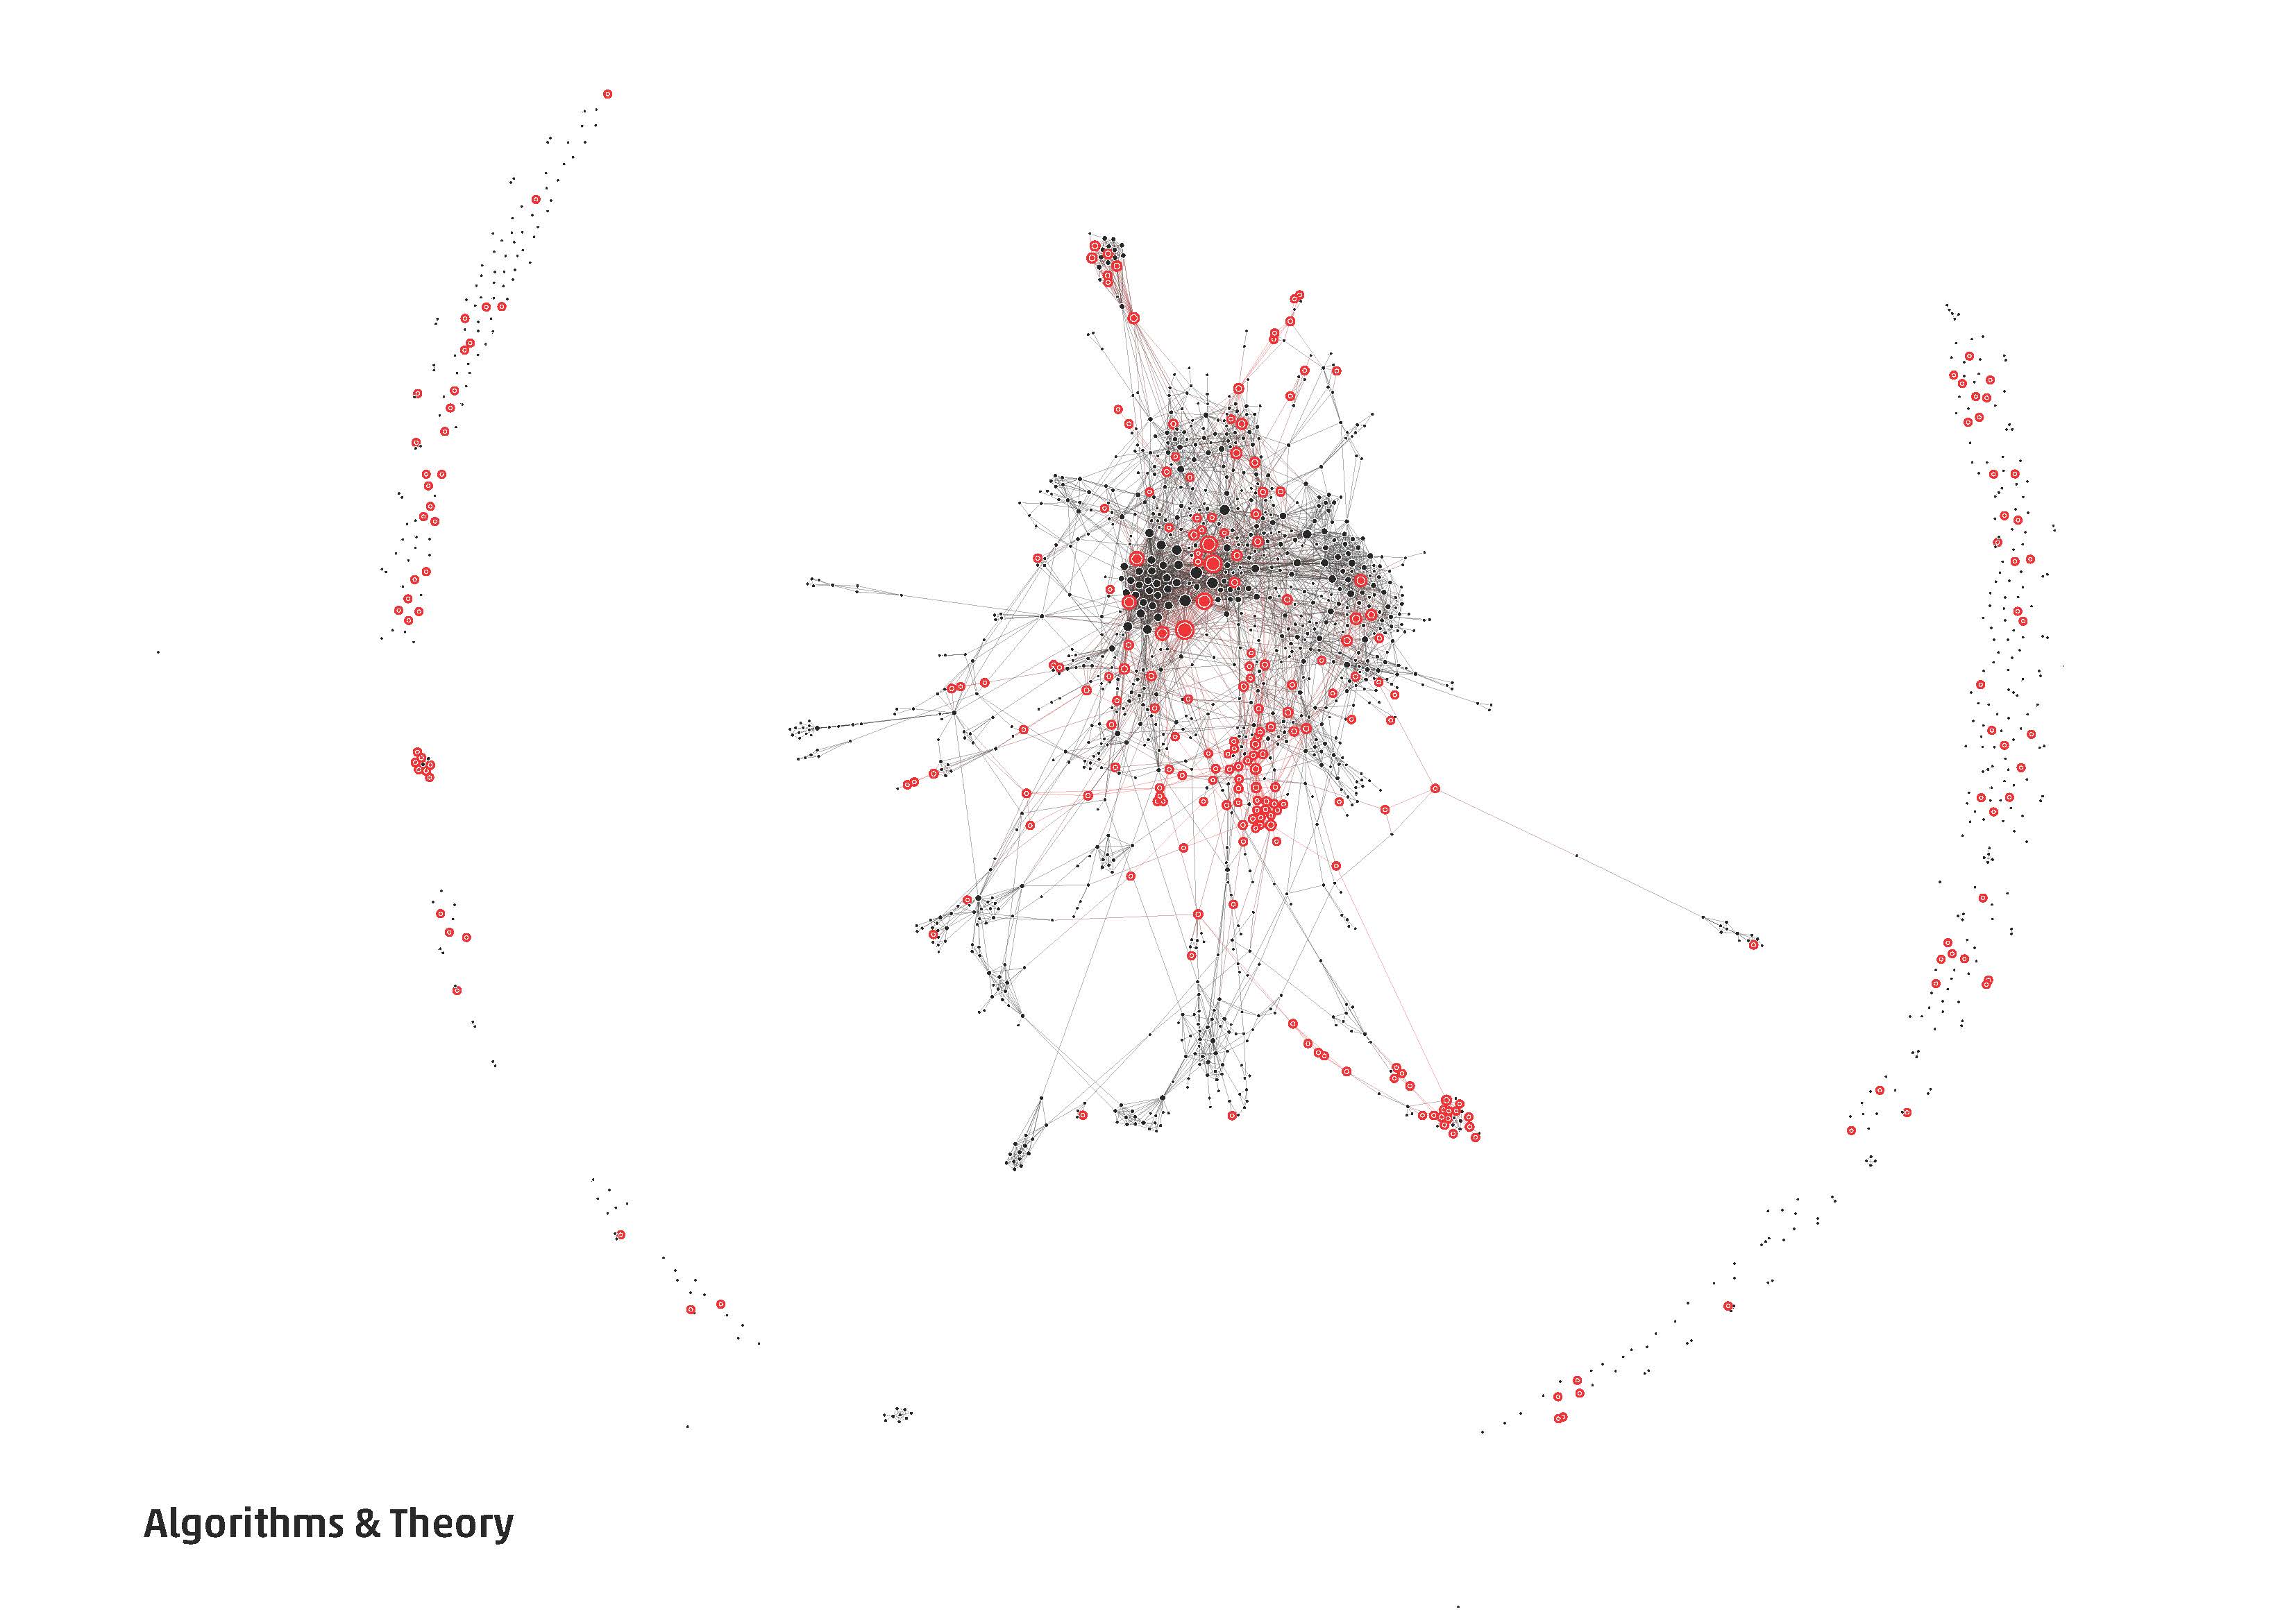
Large and distributed
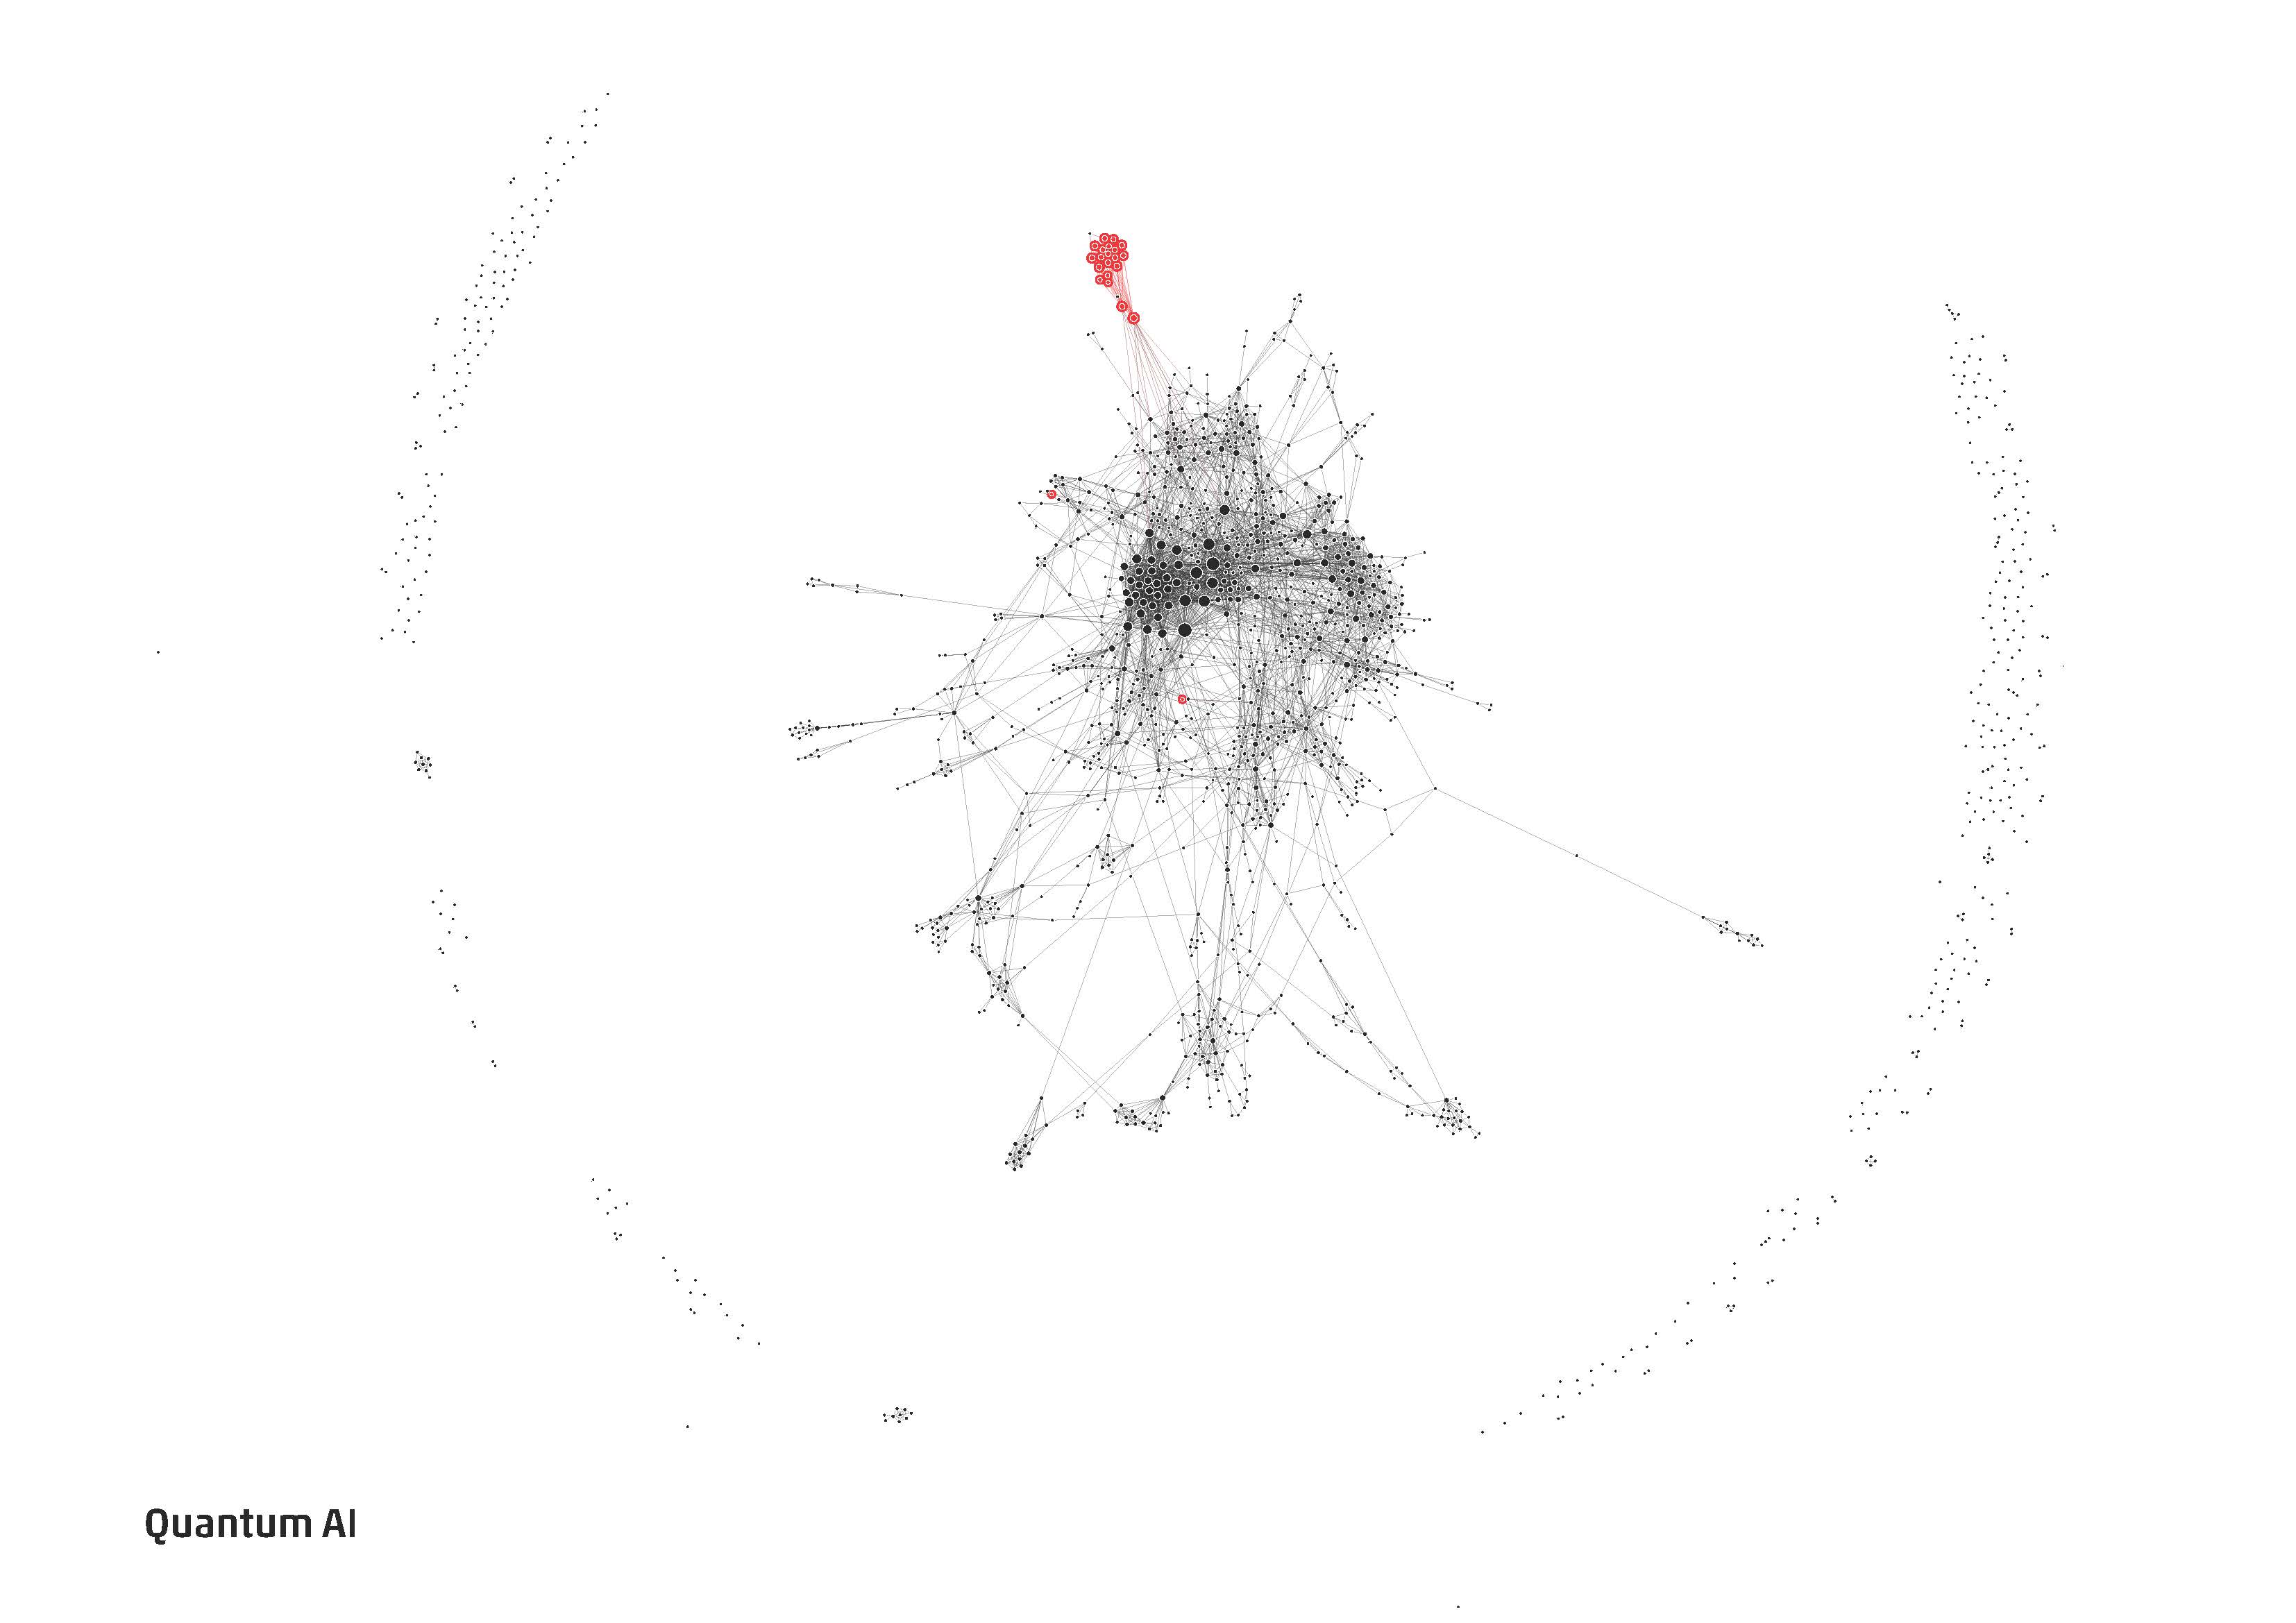
Small and centralized
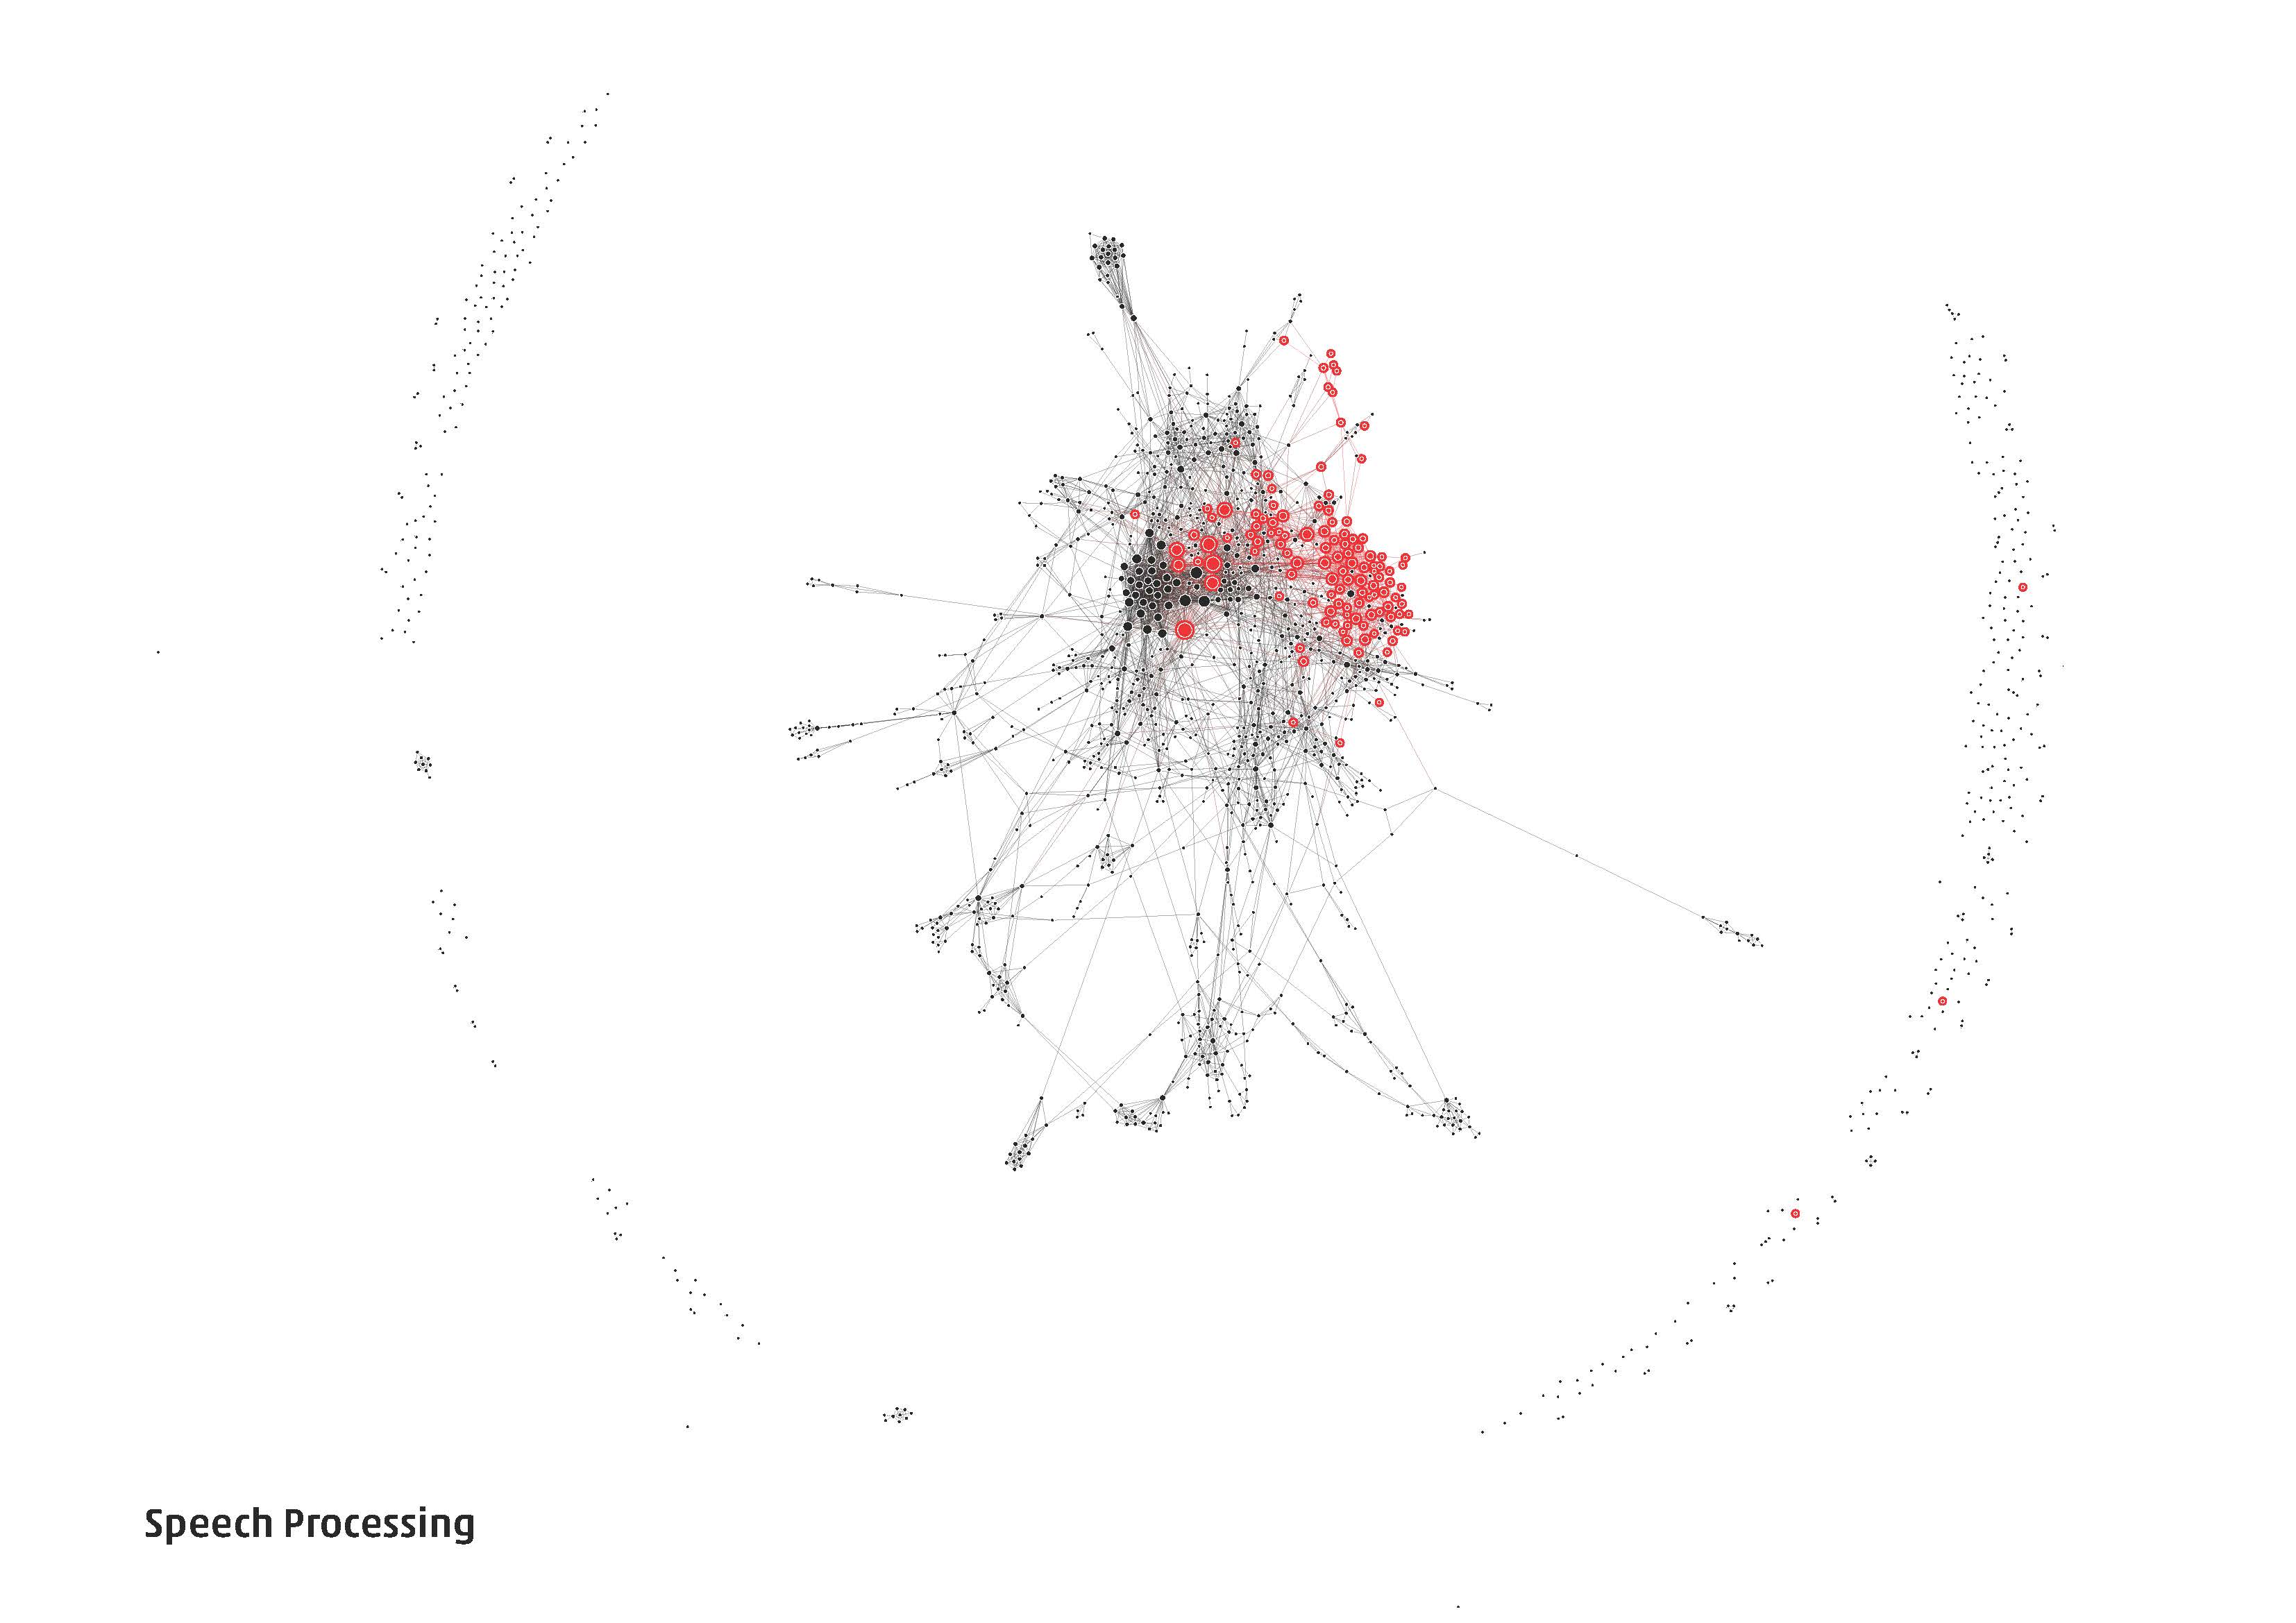
Large and centralized
